Here we show how a strategy with Volatility Breakout could work in a time range of a few or many quarters of an hour. We call this swing-trading strategy “The Locust”.
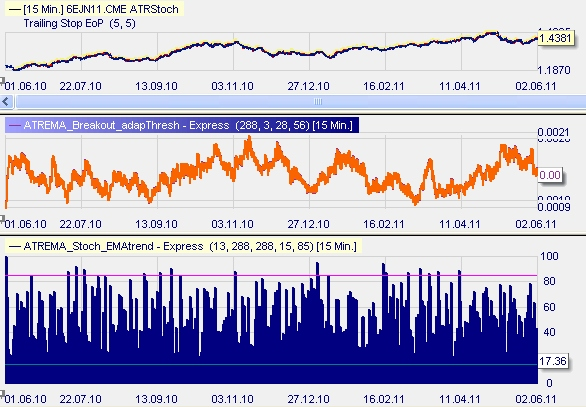
7.2.1. Here we have a year of the Euro vs the US-Dollar of 2011 (the June 2011 future). In the middle is the ATREMA, the ATR of 228 periods ( aka 3 days) with an EMA of 3 periods and two lookback points to figure out the actual trend. The breakout should be traden following the trend.
The there is the stochastic indicator on that ATREMA with two thresholds
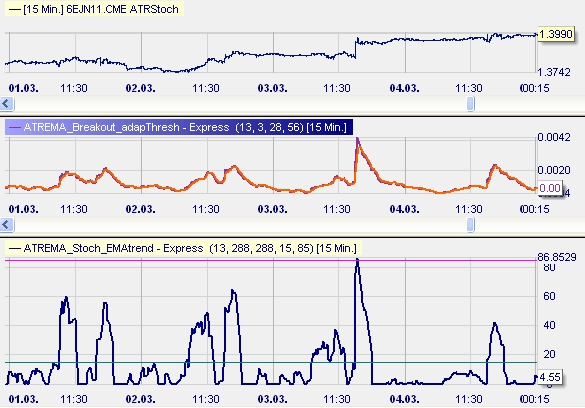
This picture gives a detail view. The market (Euro/US-Dollar, 15 minutes). ATREMA. Atrema-Stochastics-EMA with two thresholds.
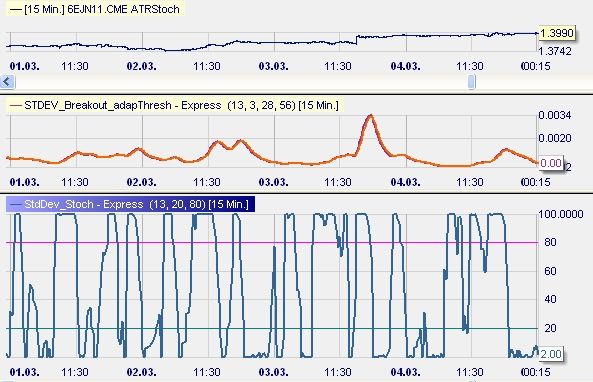
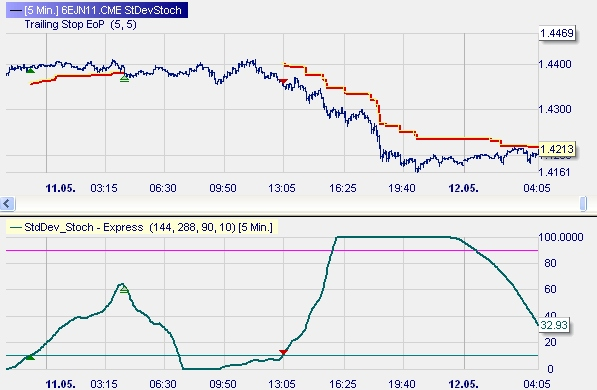
We can have the same with the stochastics on an EMA of the Standard Deviation. Same market, same time-frame. Yet looks quite different. The standard deviation gives more signals than the ATR. Maybe too much signals.
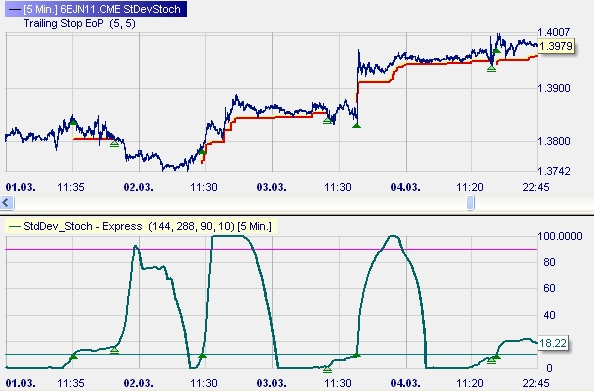
Closer look. Entry signals are happening when the StDev moves above the lower threshold from very low or zero. We secure the trade with a trailing stop. We could also exit the trade as soon as the StDev moves above or below the upper thresholds.
Works also with short trades. Sell or buy depends on the trend filter.
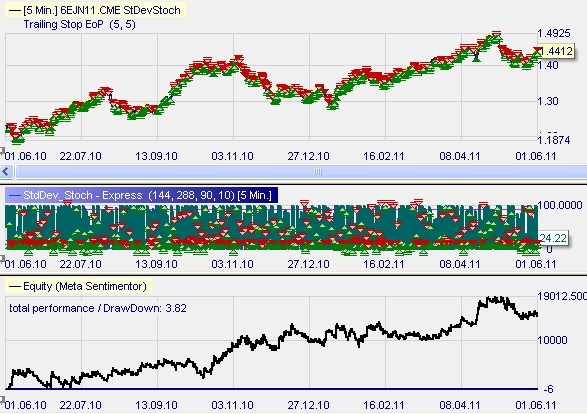
In that year (June 2010 to 2011) this strategy would have performed pretty well.

We could apply it as well to other markets, like here is the FESX (EuroStoxx50). See the diffrence of signals between the stochastics on ATR and StDev.
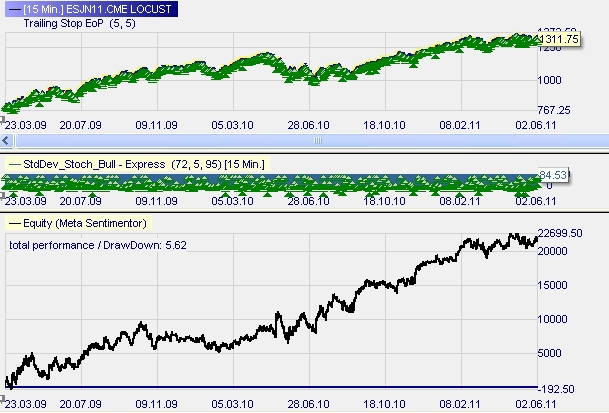
It would have worked very well with the E-mini S&P, when we only trade bullish, But that was a bullish trend market and we should see how it performs with sideways markets.
Next page: Chapter 7-3, the Oryx back to overview page “Charts”