6.1. Channel Breakouts
These chart pictures and text illustrate the development of a trading strategy making use of channel breakouts.
The characteristics of channel breakouts are explained in the book “Superior Trader – Strategy”.

6.1. A market (here FDAX, 15 minutes) bounces back from a support line until it breaks through to a steep decline.
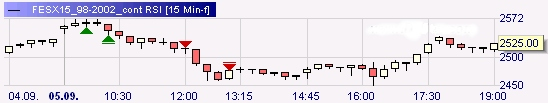
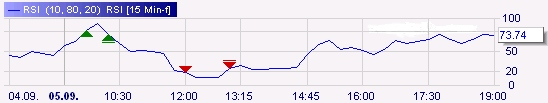
A breakout above overbought and a breakout below oversold as indicated by a RSI.
We usually trade Overbought /Oversold contrarian. But there may be conditions where we could profit from the breakout.
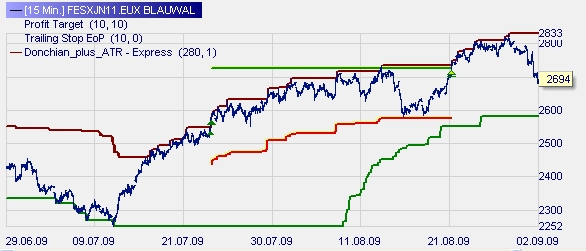
An example of a breakout from Support/Resistance indicated by a Donchian Channel.
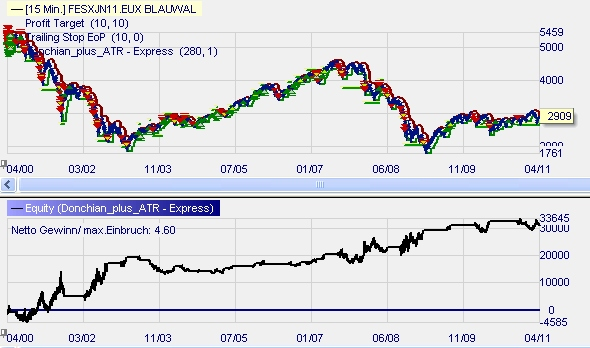
The breakouts from long-term Donchian Channels work well when there are strongtrends.