Charts of Chapter 7.3.
Chapter 7.1.: Volatility Breakouts
These chart pictures and text illustrate the development of a trading strategy making use of volatility breakouts.
The characteristics of volatility breakouts are explained in the book “Superior Trader – Strategy”.
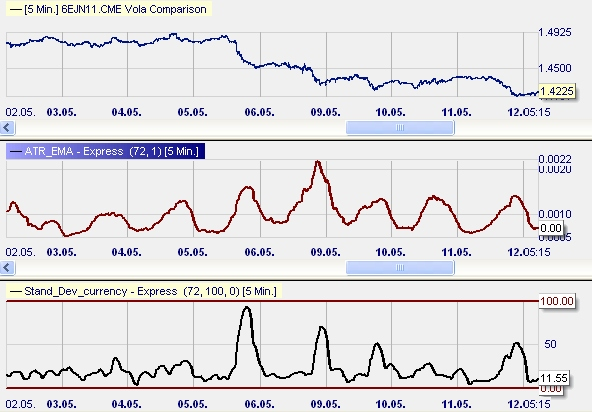
7.1. The volatility of any market (here it is the Euro vs. US-Dollar, 5 minutesw-chart, some days in 2011) can be measured and shown by the indicators “Average Ture Range” (ATR) and/or “Standard Deviation” (StDev)
7.2. We can put an EMA (Exponential Moving Average) to the ATR. It shows us when the ATR is relatively high to its own average.
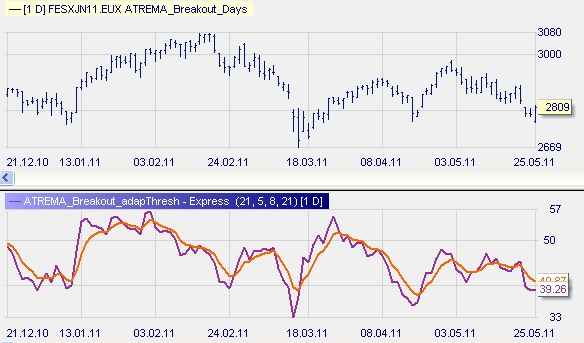
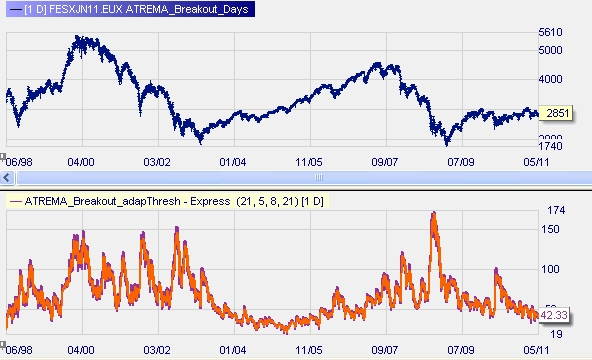
7.3. We may use it on a daily basis as well. Here the EMA (orange line) on the ATR (purple line) gives entry signals when the ATR moves over the EMA.
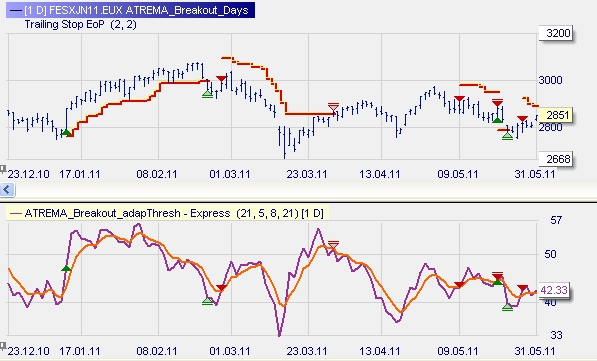
7.4. Combined with a trailing stop with could make a good strategy on a multi-day-trading. The EMA on the ATR presents entry signals long and short equally. This example shows that volatily increases serve as good entry points for trades.
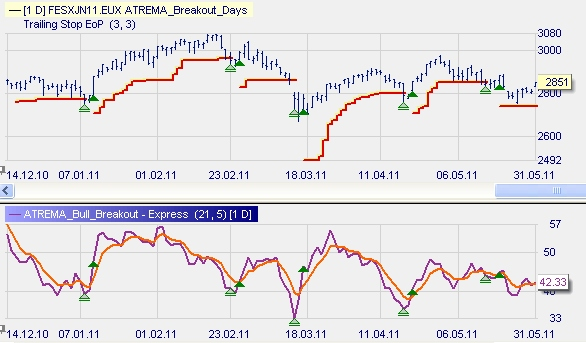
7.5. He we only take the long-entires as the overall market was bullsih. We, however, have to realize that it requires a good trade-management braucht: the trade starting at February 24th went bad after all. This was to demonstrate the principe. We would not really recommend this strategy on a daily basis.
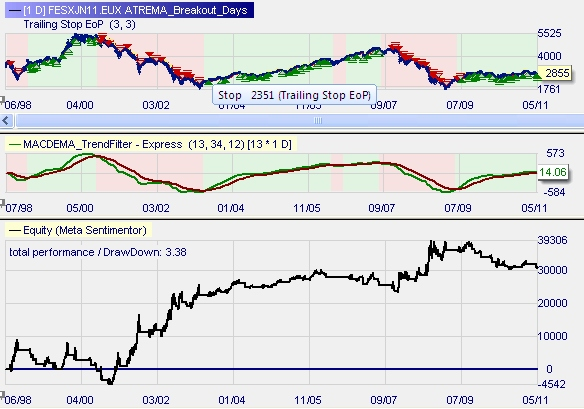
7.6. Here is the result of the approach from a long term backtesting. Combined with trend-filter, here a MACD, it brings in decent results.
At the next pages we made use of volatility breakouts in strategies of swing- and a daytrading where they are quite appealing. The we use indicator with stochastics on ATR and/or Standard Deviation.
Charts of Chapter 7.2
Charts of Chapter 7.3.
back to overview page “Charts”